Visualize and gain insight to your data
Contact Us

Real-time business "on the fly"
analytics presented
Visualize and gain insight to your data

Real-time business
analytics presented
"on the fly"
Visualize and gain insight to your data
Our Solution
Is here to simplify the extraction of data from manufacturing ERPs, CRM and other data sources to visualize key performance indicators through dynamic graphic dashboards in a simple and easy way.
By visualizing metrics, users can gain insight to areas of opportunity for their business, leading them to make better decisions and as a result, obtain improved performance.
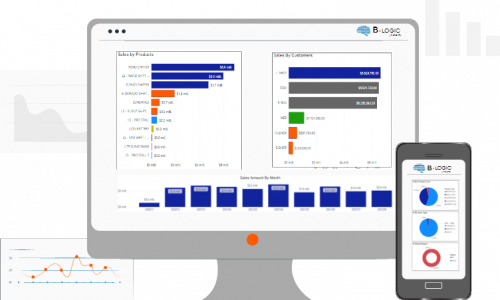
Our B.Logic solution is here to simplify the extraction of data from manufacturing ERPs, CRM and other data sources to visualize key performance indicators through dynamic graphic dashboards in a simple and easy way.
By visualizing metrics, users can gain insight to areas of opportunity for their business, leading them to make better decisions and as a result, obtain improved performance.

Our B.Logic solution is here to simplify the extraction of data from manufacturing ERPs, CRM and other data sources to visualize key performance indicators through dynamic graphic dashboards in a simple and easy way.

By visualizing metrics, users can gain insight to areas of opportunity for their business, leading them to make better decisions and as a result, obtain improved performance.
Benefits
Visualize and analyze results in
an easy and friendly way
Find opportunities based on your
company's analytics
Optimize your decision-making
Set Leading and Lagging Indicators outside of the ERP
Make quick comparisons of past
to current/forecasted vs actual results
Visualize and analyze
results in an easy and
friendly way
Find opportunities based
on your company's
analytics
Optimize your
decision-making
Visualize and analyze
results in an easy and
friendly way
Find opportunities based
on your company's
analytics
Optimize your
decision-making
Make quick comparisons of past to current/
forecasted vs actual results
Set Leading and Lagging Indicators outside of the ERP
Set Leading and Lagging Indicators outside of the ERP
Make quick comparisons of past to current/
forecasted vs actual results
Solutions
Leverages Microsoft Power BI
and Microsoft Teams
Works across multiple ERP’s
and Data Sources
Data Model and Reports are
part of your domain/tenant
Projects are modular in nature,
deployments are fast
Value Pricing for the middle
market manufacturer
Leverages Microsoft Power
BI and Microsoft Teams
Works across multiple ERP’s
and Data Sources
Data Models and Reports are
part of your MS Tenant
Projects are modular in nature,
deployments are fast
Value Pricing for the middle
market manufacturer


Leverages Microsoft Power
BI and Microsoft Teams
Works across multiple ERP’s and Data Sources
Data Models and Reports are part of your MS Tenant
Projects are modular in nature, deployments are fast
Value Pricing for the middle market manufacturer


Contact Us
Better,
Faster
Decisions
Better,
Faster
Decisions
Do you have any
questions about our
products & services?


